
August sees us here in Aotearoa (New Zealand) getting more sunshine as the days get longer again. Also, we went away to Europe in the last week of the month. How did we do?
Some Stats
Here’s some stats for Aug-2026.
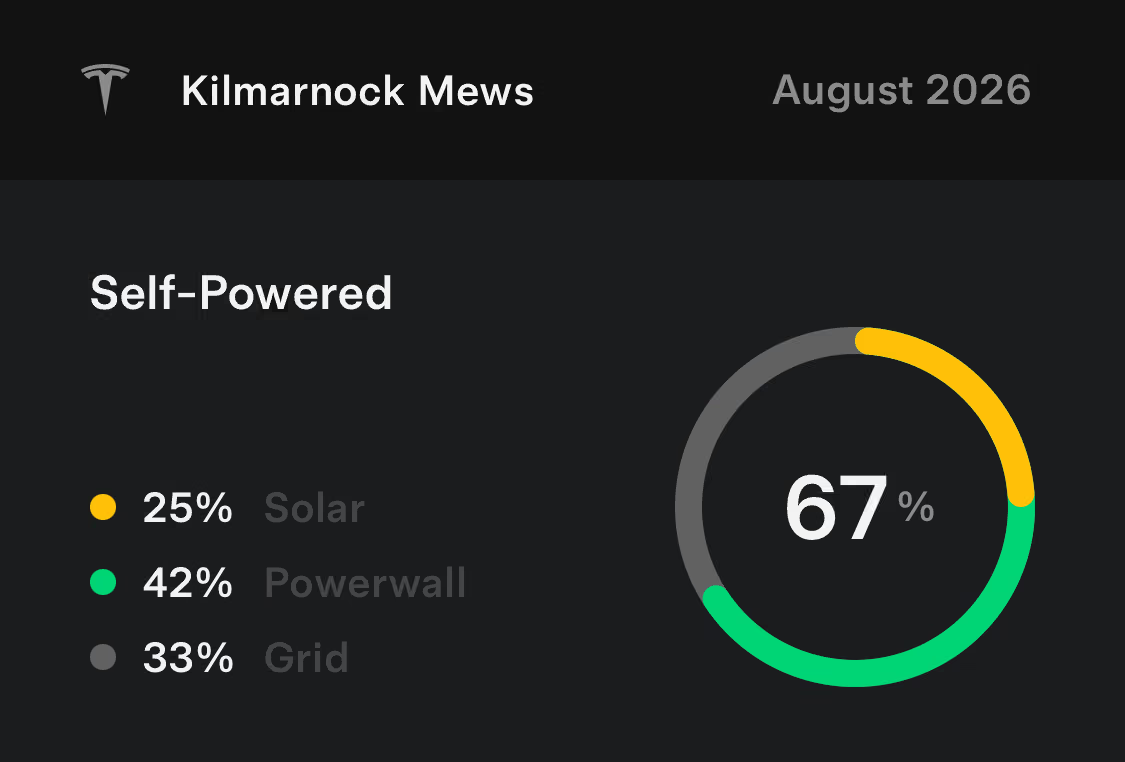
209.2 (from solar) – 25%
345.8 (from battery) – 42%
253.3 (from grid) – 33%
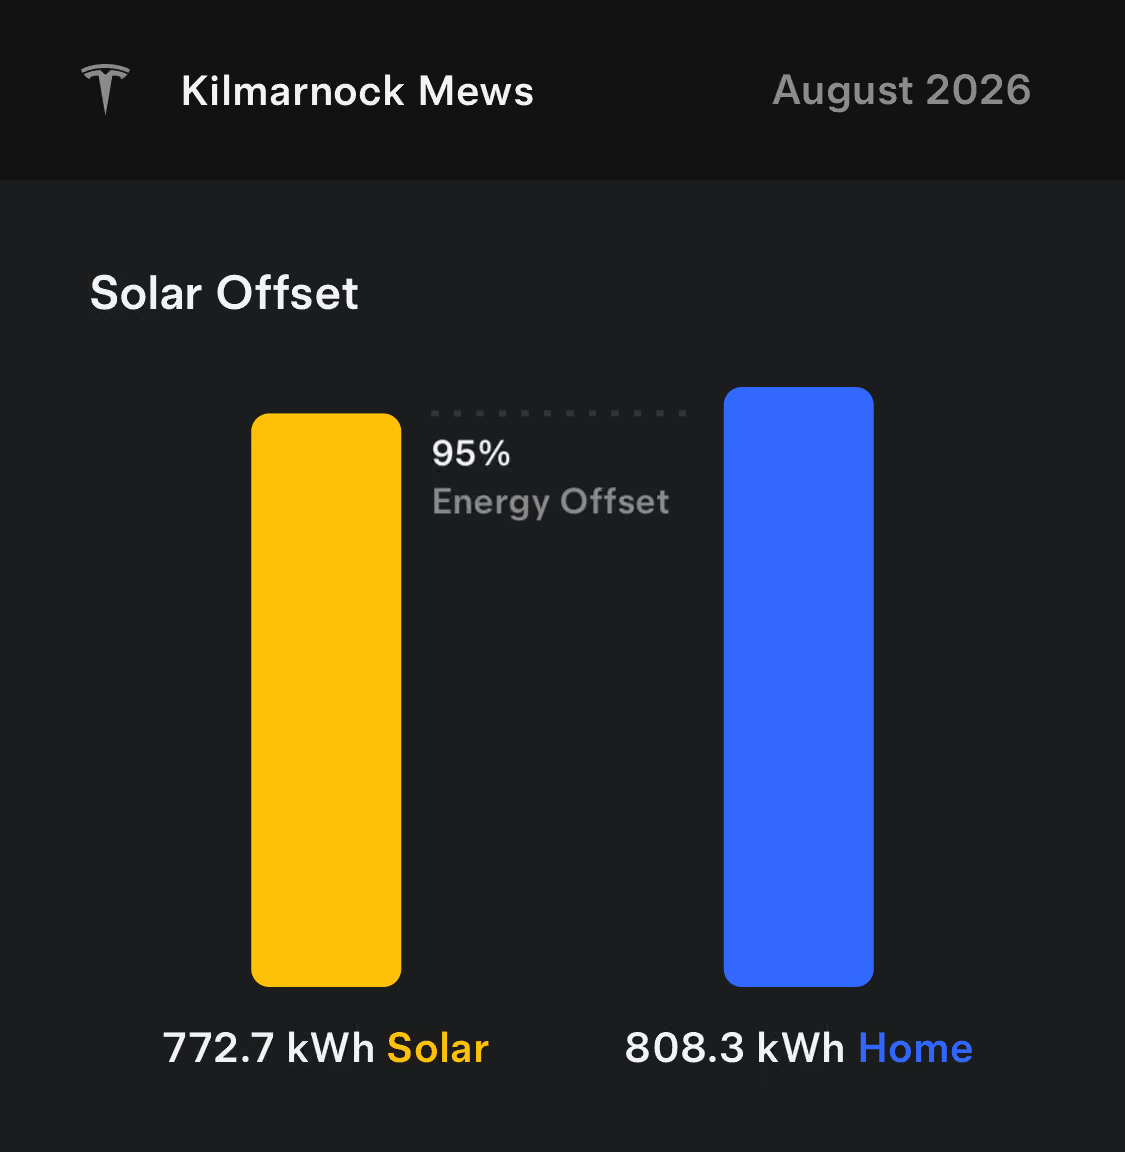
Total: 808.3 kWh
209.2 (to home) – 27%
199.4 (to battery) – 25%
364.1 (to grid) – 48%
Total: 772.7 kWh
Charged
199.4 (from solar) – 56%
152.9 (from grid) – 44%
Total: 352.3 kWh
Discharged
345.8 (to home)
0.2 (to grid)
Total: 346.0 kWh
Imported
253.3 (to home) – 62%
152.9 (to battery) – 38%
Total: 406.2 kWh
Time-of-Use Breakdown
299.1 Super Off-Peak – 74%
86.2 Off-Peak – 21%
20.7 Partial Peak – 5%
0.2 Peak – 0%
Total Import Cost: $88.70
Exported
364.1 (from solar)
0.2 (from battery)
Total: 364.3 kWh
Time-of-Use Breakdown
233.2 Partial Peak – 64%
131.0 Peak – 36%
Total Export Credit: $72.70
Net Charge: $15.99
Daily Charge (30 days): $48.60
Total Charge Expected: $64.59
Actual Charge Billed: $53.57
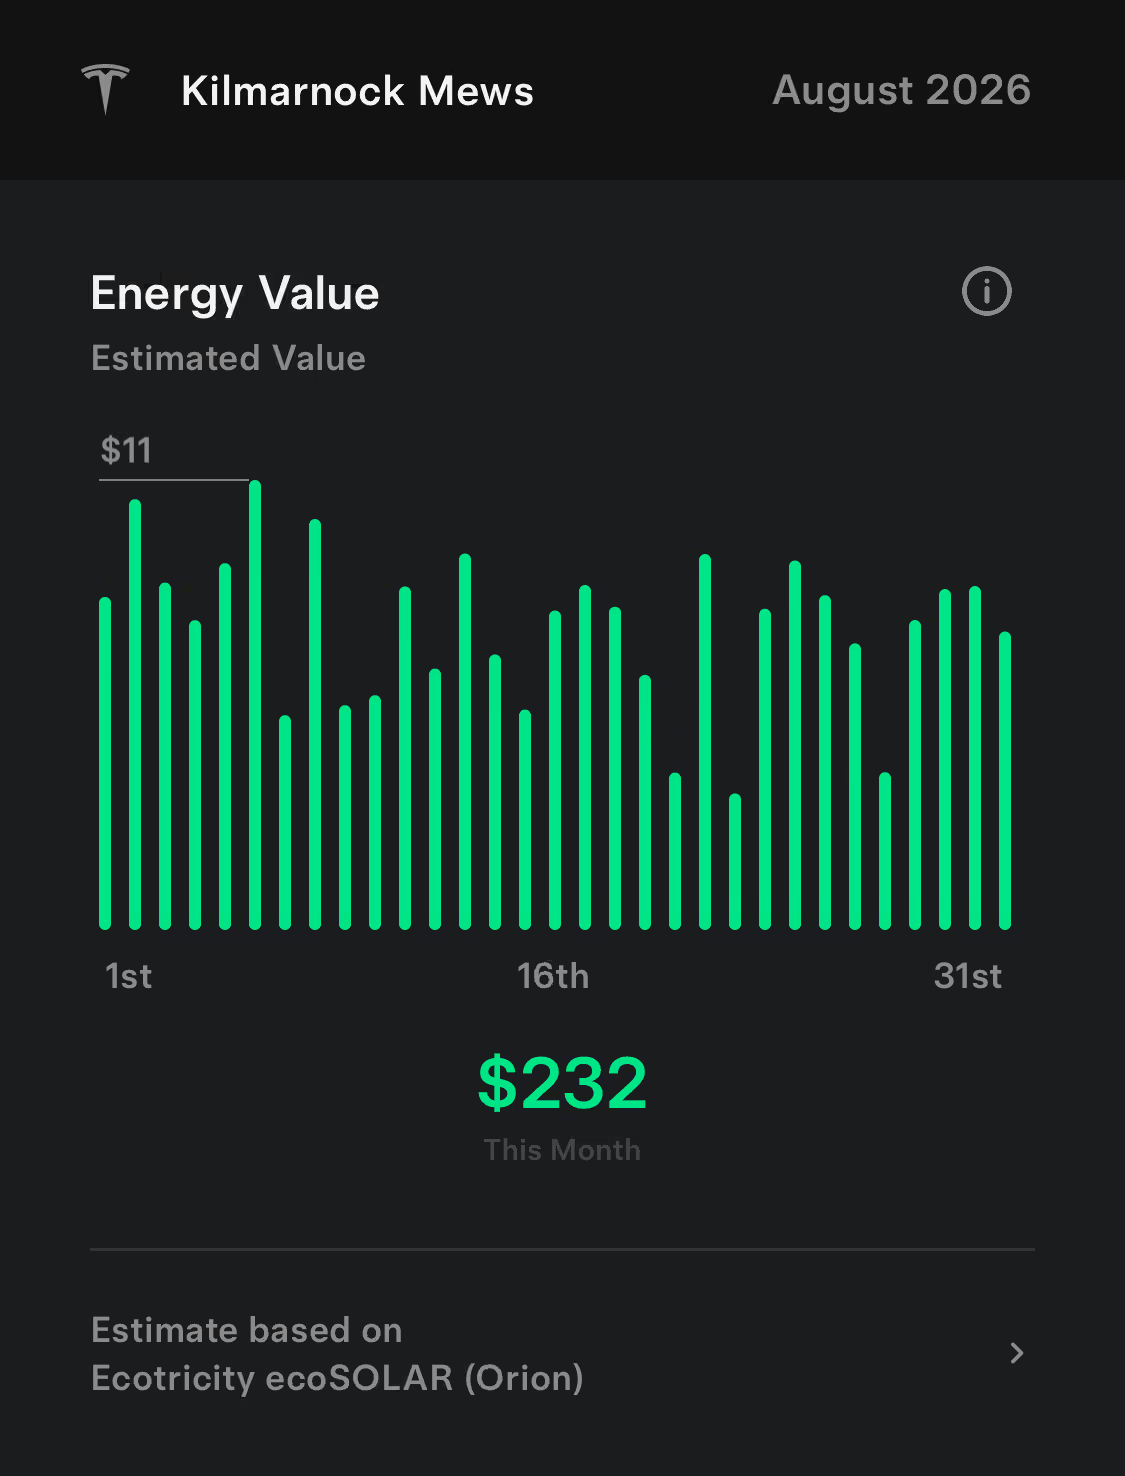
Savings from the solar & battery system as estimated by the manufacturer: $232
Graphs & Charts
Findings
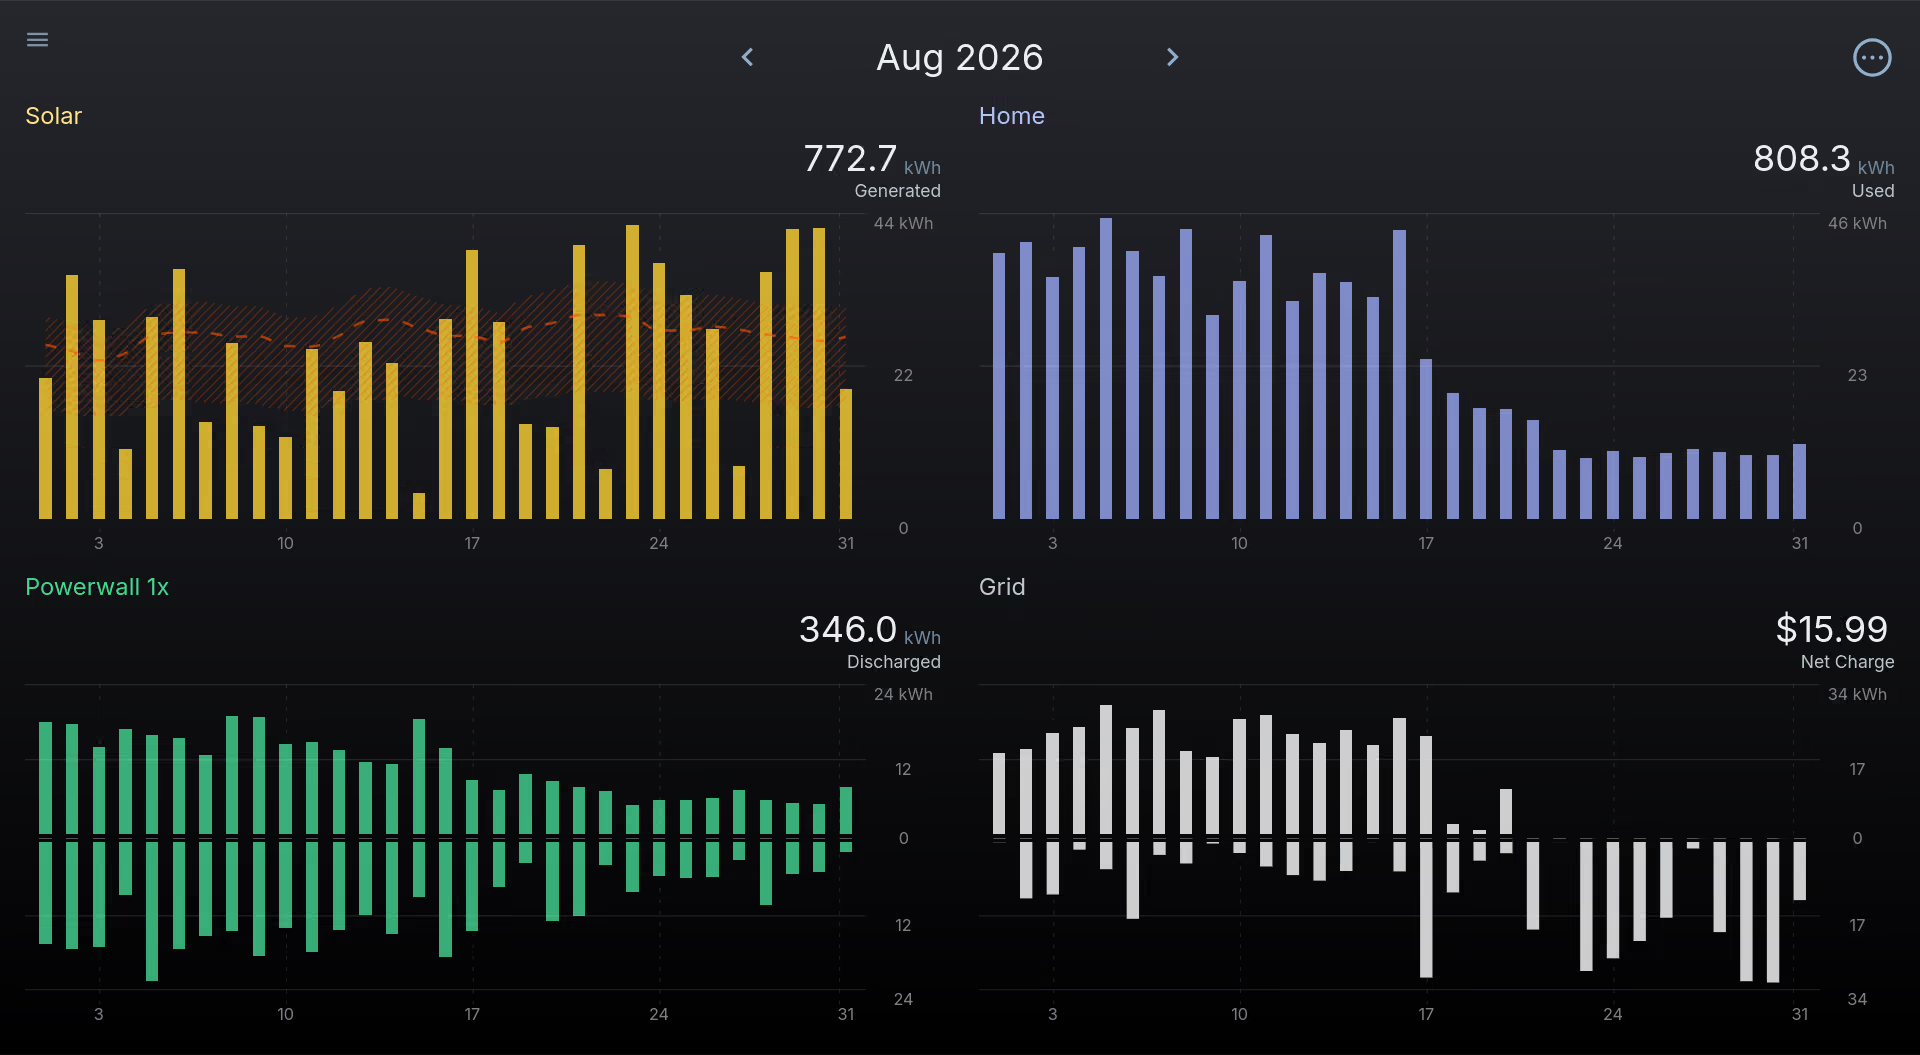
As the days get longer, we are exporting more and more solar energy to the grid for a credit. This, combined with us using less electricity for the month (because we were away for almost half the month) resulted in a very small bill.
We’re glad that the house is now passively generating income, even when nobody is home 🙂