
We’ve got our first full month of electricity usage since installing solar panels and a home battery. How did we do?
TL;DR.
The first full month of solar and battery usage resulted in a net charge of $127.77, plus daily charges totalling $48.55. Despite being winter, the system achieved significant savings compared to the previous year’s June bill of $328.85.Some Stats
Here’s some interesting (to me at least!) stats. Note that we only started exporting electricity to the grid from 23-June-2026.
231.7 (from solar) – 22%
364.1 (from battery) – 35%
417.5 (from grid) – 43%
Total: 1,013.3 kWh
231.7 (to home) – 49%
212.3 (to battery) – 45%
22.5 (to grid) – 6%
Total: 466.4 kWh
Charged
212.3 (from solar) – 55%
168.9 (from grid) – 45%
Total: 381.2 kWh
Discharged
364.1 (to home)
0.2 (to grid)1
Total: 364.3 kWh
Imported
417.5 (to home) – 71%
168.9 (to battery) – 29%
Total: 586.4 kWh
Time-of-Use Breakdown
333.6 Super Off-Peak – 57%
187.8 Off-Peak – 32%
62.9 Partial Peak – 11%
2.0 Peak – 0%
Total Import Cost: $132.97
Net Charge: $128.29
Daily Charge (30 days): $48.54
Total Charge Expected: $176.834
Actual Charge Billed: $179.73
Savings from the solar & battery system as estimated by the manufacturer: $177
- may not be true, presented here as reported ↩︎
- may not be true, presented here as reported ↩︎
- figures don’t fully add up to total export figure, presented here as reported ↩︎
- not including line losses, which is estimated to be around 5% ↩︎
Graphs & Charts
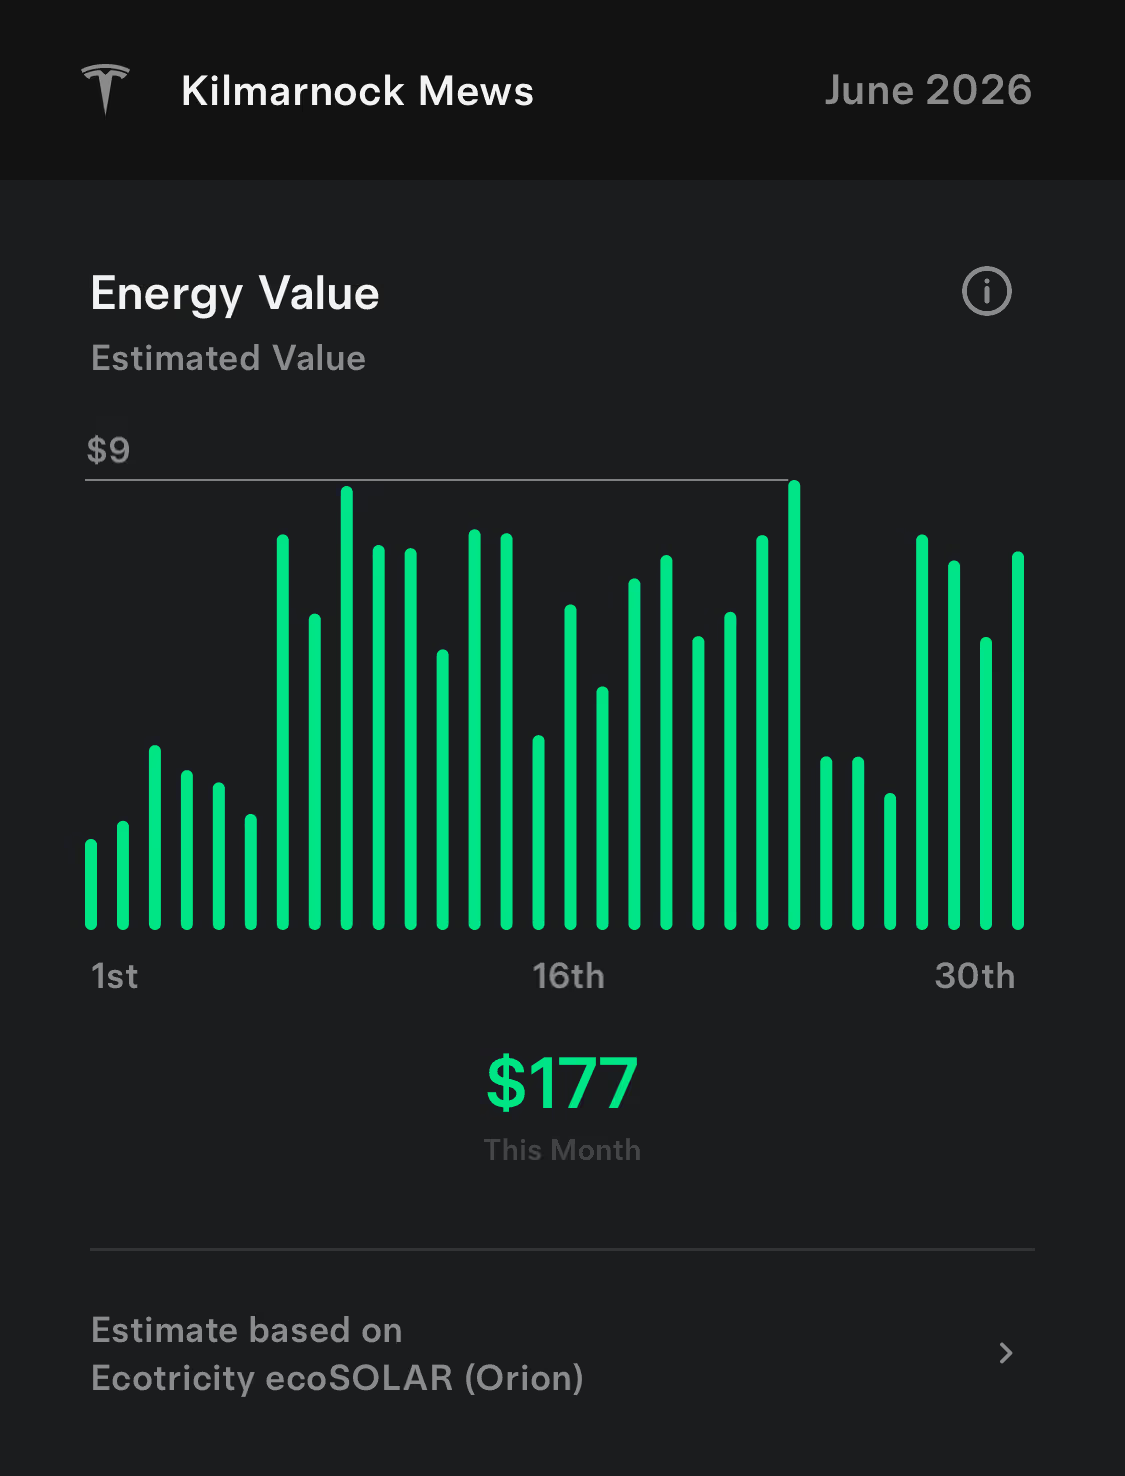
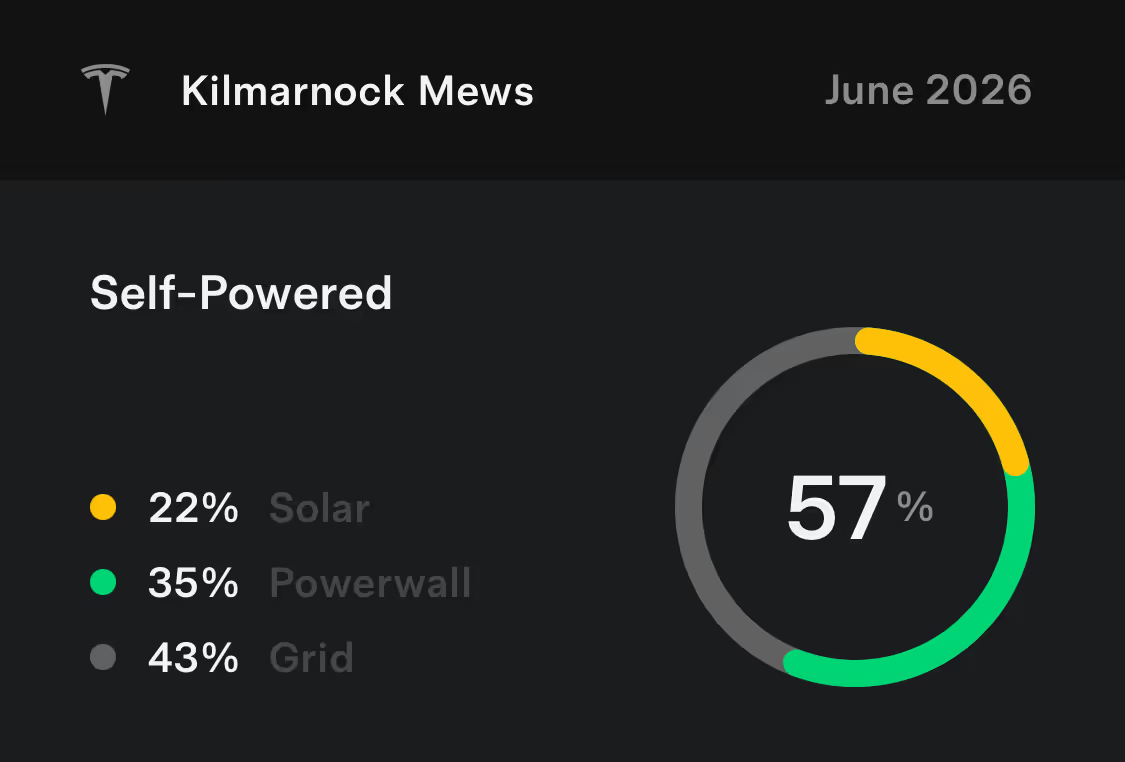
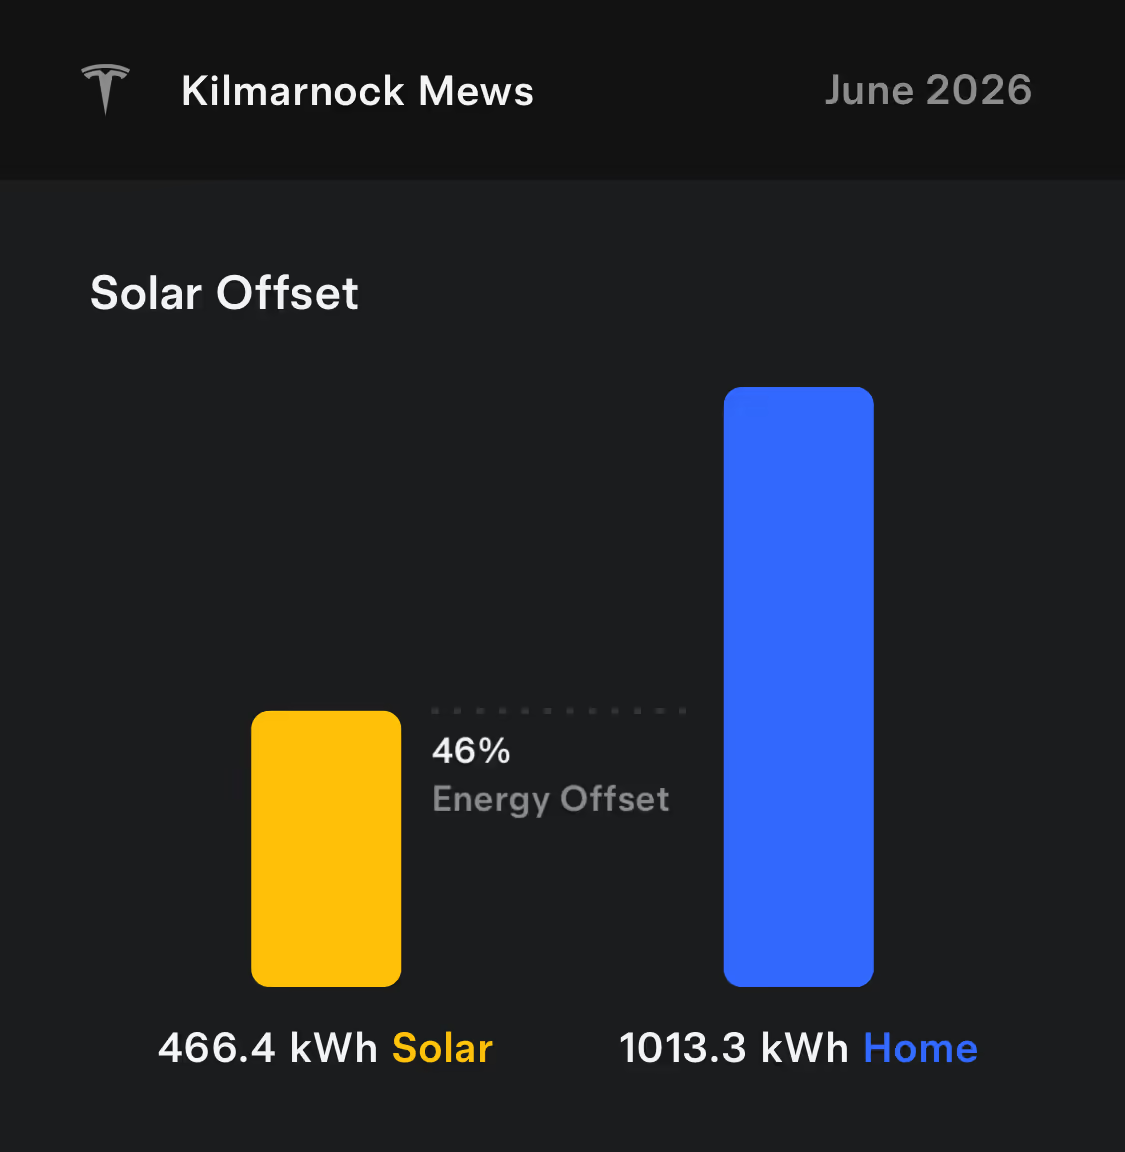
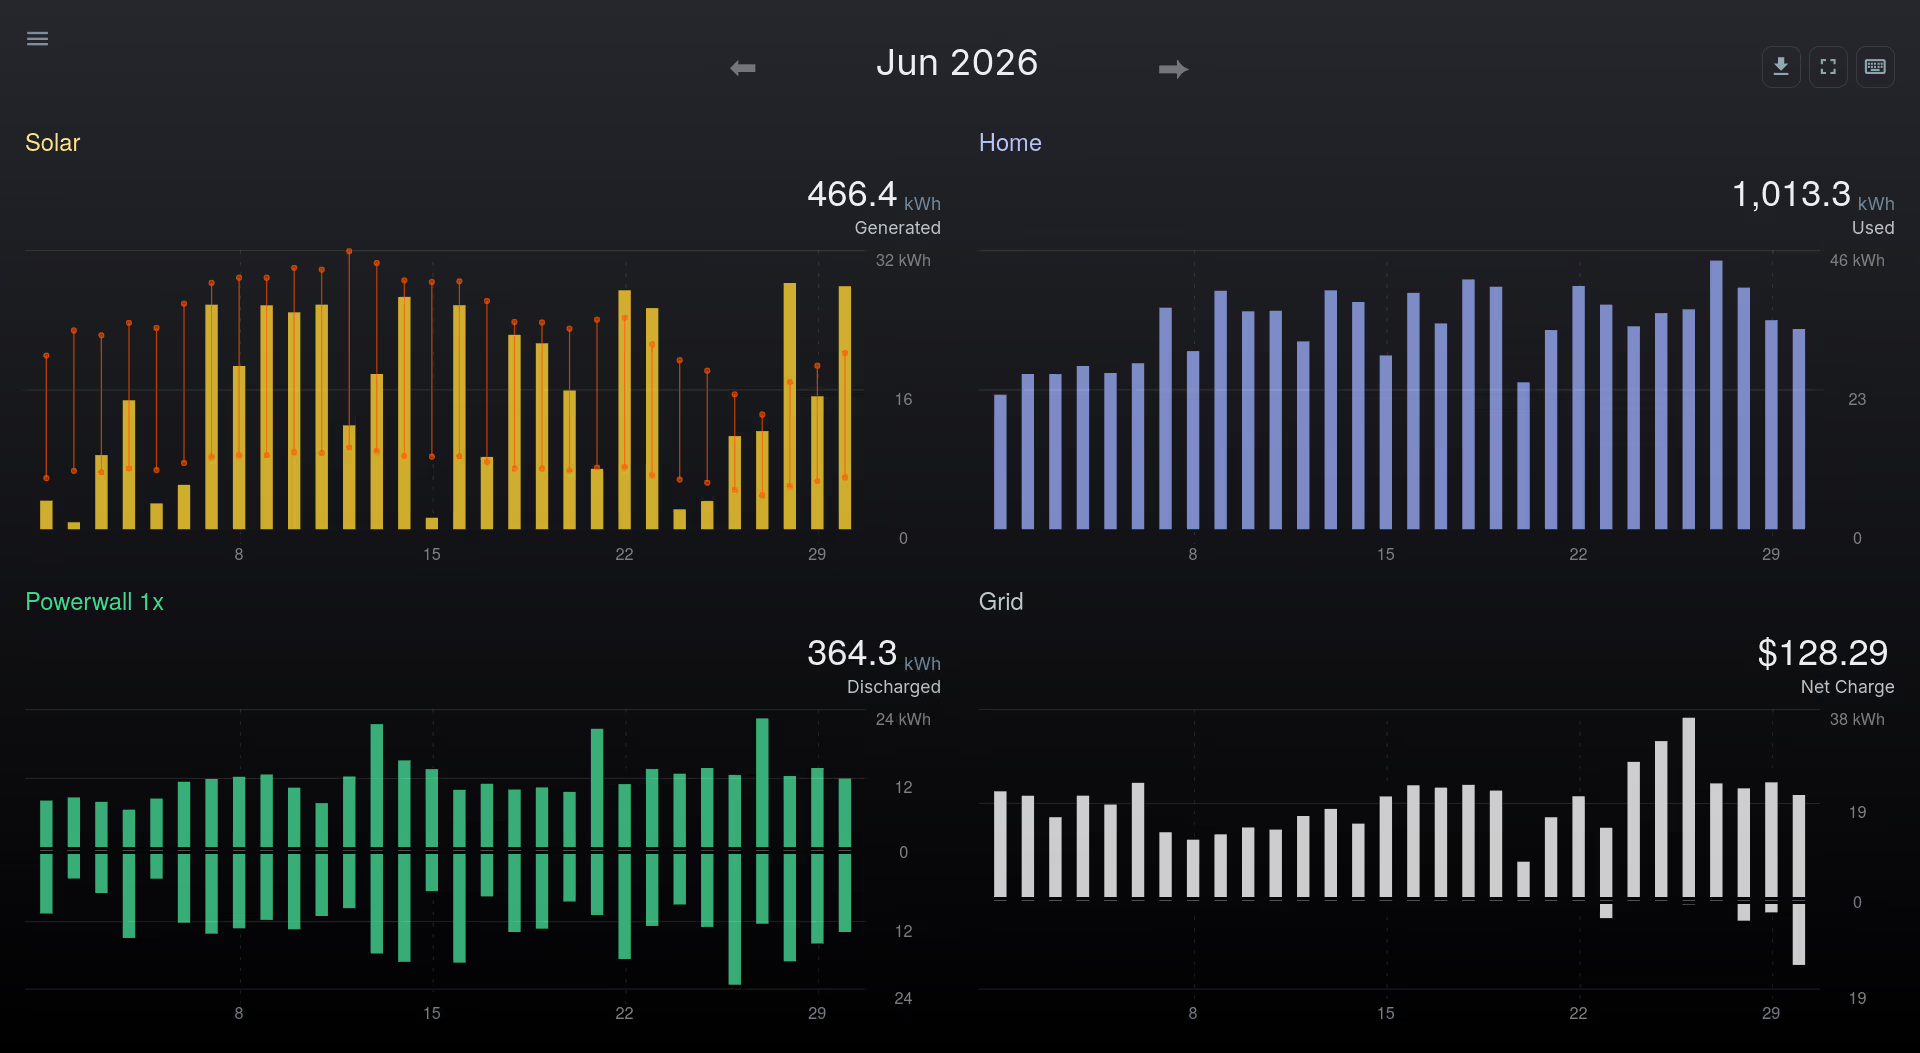
Findings
Considering that it’s June (winter in the southern hemisphere), I’m surprised at how much savings the system is able to achieve.
My electricity bill for last year (June 2025) is about $328.85 (average of two bills covering 16-May to 15-Jun, and 16-Jun to 15-Jul), with considerable lower per-kWh costs and daily charges then, I think we have done very well here!